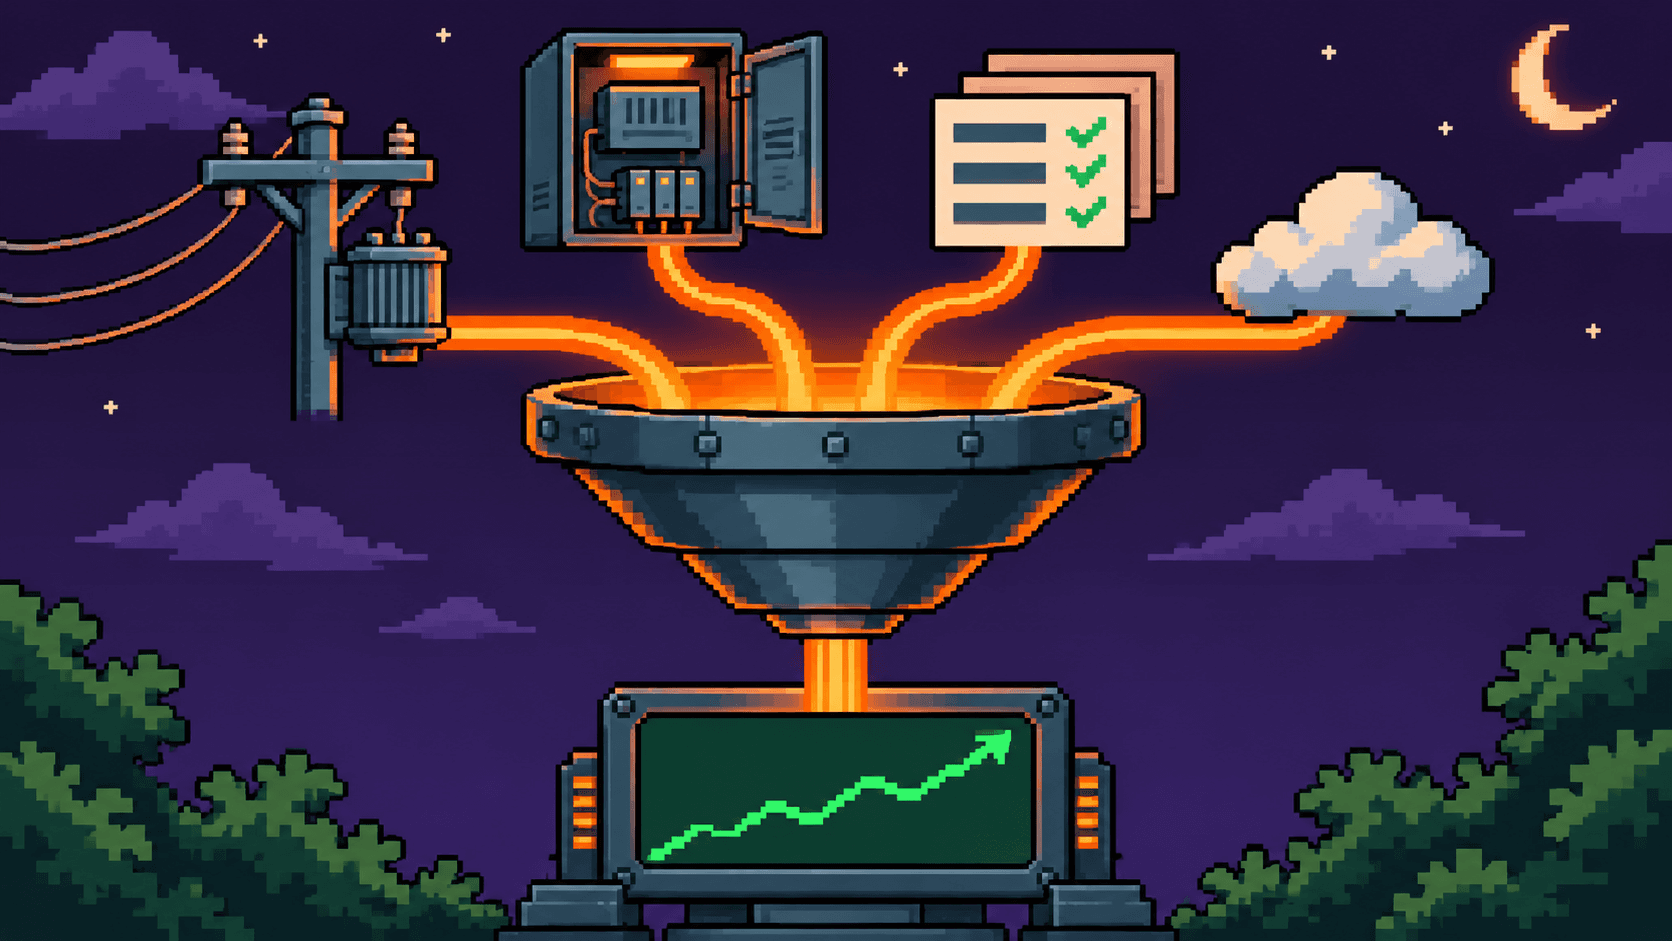
Since 1 January 2025, the BACS decree (French decree 2020-887 on building automation and control systems) has required commercial buildings whose heating or air-conditioning exceeds 290 kW to monitor their consumption[1][1]RegulationLégifrance, Decree No. 2020-887 of 20 July 2020 on building automation and control systems in non-residential buildings and automatic heat regulation (BACS decree), deadline of 1 January 2025 for heating or air-conditioning systems above 290 kWSee in sources ↓. Grid metering, BMS sub-meters, electricity or natural gas bills: on every site, energy consumption data pours in without anyone knowing which figures to trust.
Yet an EMS is only as good as its data. Identify the source, qualify the energy data, then choose the time step according to the decision.
Where a commercial building's energy consumption data comes from
Grid, BMS, bills, open data: four sources for four questions
Energy management is an approach that is only worth as much as its data. Everything therefore starts with collecting consumption data, fed by four sources that do not answer the same question. Metering by the network operators tells you how much, at the delivery points. BMS sub-metering tells you where and when. Bills from your electricity or natural gas supply contract tell you how much you paid. Finally, open data published on data.gouv.fr (the French government open data platform) or by Agence ORE (the data agency of French energy distribution network operators) aggregates local data. The diagram below compares these four sources on five criteria, from time step to relevant use.
Four sources, four questions: what each one really tells you
Grid metering, BMS sub-metering, bills and open data, compared on five criteria.Read row by row, the diagram is clear: no single source answers all four questions. The overall picture comes from cross-checking them. That is where energy data starts to support a decision.
Smart meters and customer portals: Enedis and GRDF data at the delivery point
With a smart meter, the customer portal shows electricity consumption data down to half-hourly intervals[2][2]Bodies and institutionsEnercoop, “How to read my consumption data curves” (Comment lire mes courbes de données de consommation), curve down to half-hourly intervalsSee in sources ↓. GRDF (the main French gas distribution network operator) provides gas consumption data at a daily time step[3][3]Bodies and institutionsGRDF, “Business gas consumption data” (Données de consommation gaz des entreprises), daily readings, multi-site and bulk importSee in sources ↓. Enedis (the main French electricity distribution network operator) also exposes consumption and production data, including rooftop photovoltaics[4][4]Bodies and institutionsEnedis, “Accessing my electricity consumption and production data” (J’accède à mes données de consommation et de production d’électricité)See in sources ↓.
These tools, designed first for households, assume a contract holder. A third party only gets access with the customer's consent. In a multi-tenant building, the contract holder is often the tenant company. A landlord who wants the load curves must then obtain the tenant's agreement.
BMS data and sub-metering: should you meter by end use?
The grid meter curve does not see end uses: an AHU running at night is lost in the total. The sub-meters of the BMS (building management system) isolate the end use or the zone.
Fed back to the supervision dashboard, this BMS data lets you track the consumption of an AHU or a floor. Such sub-metering is only worthwhile if a decision need justifies it. Which decision should it inform in your building?
Open data: data.gouv.fr, Agence ORE and SDES at municipality or EPCI level
The data.gouv.fr platform, Agence ORE and the SDES (the statistics department of the French ministry for ecological transition) publish local data on electricity and gas consumption[5][5]Bodies and institutionsdata.gouv.fr, “Energy data” (Données énergie)See in sources ↓[6][6]Bodies and institutionsAgence ORE, “Local energy data” (Données locales énergie), by geographic area and sectorSee in sources ↓[7][7]Bodies and institutionsSDES, “Local energy consumption data” (Données locales de consommation d’énergie), datasets by energy typeSee in sources ↓. The files are read by geographic area and by sector: agriculture, industry, commercial and services. Aggregated at the level of the municipality or the EPCI, this electricity and gas consumption data serves a local authority's assessment.
Did you know? This data exists because the French law on the energy transition for green growth (LTECV) requires network operators to make it available to public bodies[8][8]RegulationLégifrance, Law No. 2015-992 of 17 August 2015 on the energy transition for green growth (LTECV), article 179See in sources ↓. For business buildings, it is published down to the street address[7][7]Bodies and institutionsSDES, “Local energy consumption data” (Données locales de consommation d’énergie), datasets by energy typeSee in sources ↓, as annual consumption only: far too little to run a building.
Before deciding: qualifying consumption data
Gaps, duplicates, disconnected meters: the checks before any decision
Before arbitrating a renovation CAPEX, reporting or validating a saving, check the quality of the energy data. Deciding on an unchecked history means deciding on a rumor. Here are the seven checks to run:
- data gaps and disconnected meters;
- duplicate records on the same point;
- sum of the sub-meters compared with the main meter;
- pulse coefficients and units of measurement;
- daylight saving time changes in the timestamps;
- estimated index versus actual reading;
- invisible drifts and unexplained peaks.
A period with gaps can then be handled in two defensible ways: a flagged reconstruction or exclusion. Filling gaps silently distorts any later comparison.
Reading a building's load curve: night baseload, optimal start and weekends
A supplier's customer portal shows your consumption history at several granularities, from the year down to the load curve[2][2]Bodies and institutionsEnercoop, “How to read my consumption data curves” (Comment lire mes courbes de données de consommation), curve down to half-hourly intervalsSee in sources ↓. In an office building, three signatures are read first, starting with the night baseload: the power drawn when the premises are empty. The typical week below annotates them, with the morning peak as a reference point.
- 1Night baseloadThe power drawn when the offices are empty. If it creeps up month after month, that is energy drift.
- 2Optimal start timeThe HVAC restarts around 4 a.m., well before occupants arrive: the optimal start is too early.
- 3Morning peakPower demand peaks when staff arrive, as all end uses start up together.
- 4AHU running on SundayA manual override left active: the empty building consumes energy with no occupant to serve.
It all starts with the night. If night-time consumption creeps up month after month, that is energy drift. An optimal start set too early restarts the HVAC well before occupants arrive and heats empty offices. Weekends give away manual overrides, equipment left running. Tracking your consumption this way shows where to look for the first savings.
Time step, obligation and tool: what each level of detail lets you decide
Annual, hourly, sub-hourly: from time step to decision
Each time step serves an obligation or a decision. Each one also leaves something in the dark. The table below starts from the decision to be made and works back to the time step it requires.
Which level of detail for which decision?
Choose the decision to be made: the row that serves it lights up in the table.| Time step | What it lets you decide | Obligation or use | What it does not show |
|---|---|---|---|
| Annual | Report on the portfolio trajectory | Reporting on OPERAT (Décret tertiaire) | End uses |
| Monthly | Reconcile bills and budget | Budget tracking, bill checking | The night |
| Hourly, by functional zone | Spot a drifting zone | Consumption monitoring required by the BACS decree | Short manual overrides |
| Sub-hourly (half-hourly or less) | Correct an optimal start set too early, track down night-time manual overrides | Control and drift detection | The weather effect, without correction |
| Baseline adjusted for heating degree days (HDD) | Prove a saving under the International Performance Measurement and Verification Protocol (IPMVP) | Measurement and verification | The cause of the drift |
The two ends of the table are enough to measure the gap. Reporting on OPERAT (the French government platform for tertiary-sector energy reporting) under the Décret tertiaire (France's tertiary decree on energy savings in commercial buildings)[9][9]RegulationLégifrance, Decree No. 2019-771 of 23 July 2019 on obligations to reduce final energy consumption in commercial buildings (Décret tertiaire), annual reporting on OPERATSee in sources ↓ only requires an annual energy total. Spotting an optimal start set too early requires half-hourly data. Proving a saving calls for a baseline adjusted to conditions, for example to heating degree days (HDD, degrés-jours unifiés or DJU in France), under the International Performance Measurement and Verification Protocol (IPMVP)[10][10]Standards and protocolsEfficiency Valuation Organization, “International Performance Measurement and Verification Protocol (IPMVP)”, measurement and verification of savings with adjustments to conditionsSee in sources ↓.
Customer portal, dashboard or EMS: which tool to track consumption?
A customer portal serves a household or a single contract, not the energy monitoring of a portfolio. A dashboard goes further and turns consumption into data visualization. An EMS goes one step further: it detects the drift, which the BMS then corrects. Above it, a hypervisor aggregates several sites and several BMS brands.
The software on the market mixes up these four objects. Yet an EMS that does not write to the BMS remains a dashboard. Energy monitoring helps track consumption without correcting it. Build your EMS specification around the expected decision.
What Foobot does with your consumption data
BMS advisory: making meters reliable before trusting them
With our BMS advisory, we replay every meter in your installations: disconnections, gaps, duplicates, invisible drifts and unexplained peaks. You come away with energy monitoring whose reliability you know, meter by meter. This assignment stands on its own: no AI phase is required afterwards.
An EMS is only as good as its consumption data
Three steps come before choosing a tool. Identify the source of each curve: grid, BMS, bill or open data. Qualify it meter by meter, before basing a CAPEX, a regulatory report or a saving on it. Finally, choose the time step according to the decision to be made, rather than according to what the screen can display.
We have seen polished software running on meters that nobody had checked. An EMS is only as good as its data, whatever its interface. To get started on clean consumption data, our Foobot EMS is free: it does not do portfolio ESG reporting or multi-country.
FAQ - consumption data
Is my consumption data displayed in real time?
No. The customer portal, whether for a household or a business, shows readings with a delay. To track your consumption in near real time in a commercial building, go through the BMS and its sub-metering, at the trend logging interval.
How can I see my consumption hour by hour?
Enable load curve recording in your customer portal: it then goes down to half-hourly intervals[2][2]Bodies and institutionsEnercoop, “How to read my consumption data curves” (Comment lire mes courbes de données de consommation), curve down to half-hourly intervalsSee in sources ↓. You can also authorize a third party. This consumption monitoring only informs certain decisions, as the time-step table shows.
How is individual consumption data transmitted?
The data leaves the smart meter and goes up to the network operator, which acts under a public service mission. It then reaches the supplier or an authorized third party. Gas consumption data follows this path at GRDF[3][3]Bodies and institutionsGRDF, “Business gas consumption data” (Données de consommation gaz des entreprises), daily readings, multi-site and bulk importSee in sources ↓.
How do I read my consumption data curves?
Start with the night: a rising baseload signals drift. Then look at the optimal start time, then the weekend, where manual overrides hide. The consumption history in your customer portal is enough for this first sort.
How do I access consumption data?
The contract holder goes through their Enedis or GRDF customer portal. An EMS or a BMS advisor gets access with the customer's consent. A local authority reads the data for its municipality or EPCI, broken down by sector of activity.
Sources and references
10 sources.- [1]Légifrance, Decree No. 2020-887 of 20 July 2020 on building automation and control systems in non-residential buildings and automatic heat regulation (BACS decree), deadline of 1 January 2025 for heating or air-conditioning systems above 290 kW↑
- [8]Légifrance, Law No. 2015-992 of 17 August 2015 on the energy transition for green growth (LTECV), article 179August 2015↑
- [9]Légifrance, Decree No. 2019-771 of 23 July 2019 on obligations to reduce final energy consumption in commercial buildings (Décret tertiaire), annual reporting on OPERATJuly 2019↑
- [2]Enercoop, “How to read my consumption data curves” (Comment lire mes courbes de données de consommation), curve down to half-hourly intervals↑ 1 2 3
- [3]GRDF, “Business gas consumption data” (Données de consommation gaz des entreprises), daily readings, multi-site and bulk import↑ 1 2
- [4]Enedis, “Accessing my electricity consumption and production data” (J’accède à mes données de consommation et de production d’électricité)↑
- [5]data.gouv.fr, “Energy data” (Données énergie)↑