Predicting energy demand in buildings: US DOE Vs. Foobot
Landlords and property managers, when considering energy efficiency solutions for their buildings, need to assess the payback time and return on investment. Thus, it’s essential for them to predict accurately how much energy will be saved after changes will be made.
So the industry, architects, engineers, and energy modelers, instead of “hoping for the best” or doing guess-work, commonly use building energy models, in software such as well-known Energy Plus. When a retrofit project includes say, added insulation or LED lighting, they want to know precisely how much energy is going to be saved.
One might think that having a 3D model with physical parameters of the walls, envelope etc. would be enough. A good way to see how insufficient this is, is to look at energy consumption of a real building Vs its 3D building model:
In winter time:

Figure 1. Energy consumption of a building model before calibration (winter time)
In summer time:

Figure 2. . Energy consumption of a building model before calibration (summer time)
In the charts above, results of the model are considered good if bar charts, red and blue, are the same height throughout the day.
As you can see, the predicted energy consumption of the 3D model is way off. This is no wonder, as a building is a very complex ecosystem, influenced by a wide range of parameters. To add up to the difficulty, no two buildings are the same.
So building 3D models alone are not enough to accurately predict consumption and neither are they to evaluate the efficiency of any considered energy-saving solution.
Still, this point is crucial for decision makers when considering an energy retrofit project. They usually have two main questions about a new technology: the first one is about uncertainty and sounds like: “Will this solution live up to its promise?”. The common next question, “how long is the payback?” only makes sense to ask once reassured.
The solution to uncertainty is to calibrate the building model. After calibration, the real building and the calibrated model, if given with the same input parameters (like weather, occupancy etc.), will render the same output (like energy consumption). In other words, the amount of energy saved can be assessed way more accurately.
Get first-class indoor conditions in your office.
Learn more how Foobot AI improves thermal comfort while saving energy here
Building energy models: Existing methods
Building energy models, also known as Building Performance Simulations, have been around for as long as computers. More efforts have been put in them since the 70s energy crisis.
In regard to accuracy, calibration, which tries to reduce the error between the data from the real building and its “digital twin”, has been the field of intensified research during the past decade.
One of the most accurate methods to calibrate energy models has been developed by the National Renewable Energy Laboratory (NREL) from the Department of Energy, and the Oak Ridge National Laboratory (ORNL): it is known as PAT (Parametric Analysis Tool) and works with OpenStudio. At the end of the calibration process, the calibrated model is available to be used in Energy Plus, the widely used building energy simulation software.
In September 2018 at an ASHRAE conference on this topic, NREL and ORNL presented their calibration results[1] on their “living lab”, a 3,200 ft2 structure designed to emulate a 1980s office building.

Researchers from DOE’s NREL/ORNL not only published this study, they also generously released their code, the pre-calibration model, and all the input data and local measurements, which is very helpful for the community.
With all this, we decided to benchmark our own calibration method against the best.
Benchmarking, ins and outs
To make sure we’re comparing apples with apples, let’s set upfront that we used the same inputs, such as the local weather data, information about the structure, walls, insulation, HVAC system and many other.
As a first output, just like in the study by NREL/ORNL, we assessed a few building variables representing building characteristics that are unknown or uncertain and are therefore appropriate for adjustment during calibration:
- Roof and wall insulation values
- Infiltration schedule
- Heating and cooling set point adjustments
- Supply air duct leakage
- Window U-factor
- Solar heat gain coefficient for windows
- …and many more parameters, if need be.
Finally, to assess the quality of our calibration method, we used the recommended metrics from the ASHRAE Guideline 14 “Measurement of Energy, Demand, and Water Savings”:
- NMBE, or Normalized Mean Bias Error. This assesses whether you over or under-predict the overall consumption.
- CV(RMSE), or Coefficient of Variation of the root mean square error. This basically assesses how close you are to the individual data points (such as monthly utility bills).
Since hourly energy consumption data is available in this case, the desired goals are:
- CV(RMSE) < 30% and NMBE < 10%
For the readers who are using other guidelines, it’s interesting to note that Guideline 14 is one of the basis behind the International Performance Measurement and Verification Protocol (IPMVP).
Results
Calibration improvements
NREL/ORNL assessed their results during two sample days, a typical winter day and a typical summer day. We followed the same path.
Comparing the predicted energy consumption with our solution “Foobot SAB” Vs. NREL/ORNL method gives this:

Figure 3 – NMBE assesses whether the calibrated model over-predict or under-predict the overall consumption. Both methods achieve the target of being under 10%, although our solution predicts total energy consumption 25.9% more accurately
Both calibrated models achieve the desired goals for total consumption. Nonetheless our method performed significantly better to predict total consumption and heating consumption, while being slightly less accurate on cooling consumption; the difference in NMBE from -0.1% to 0.03% is negligible though, and far below the required 10% threshold.
Here’s the predicted consumption with our method against real consumption, during a typical winter day:

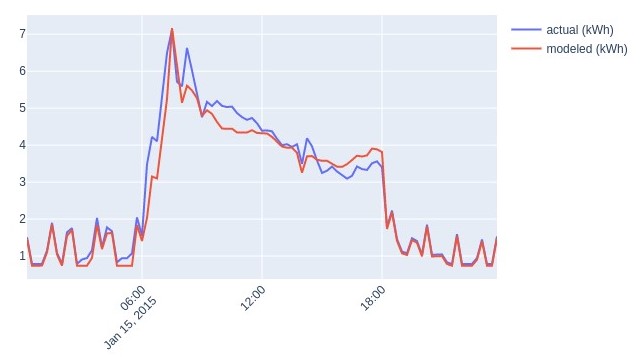
Figure 4. Energy consumption of a building model after calibration (winter time)
Here’s the predicted consumption using our method against real consumption, during a typical summer day:

Figure 5. Energy consumption of a building model after calibration (summer time)
Usability improvements
Working with our method Vs. PAT proved to be quite more user-friendly, for developers at least. All interactions are operated using a Python API, which is usually more efficient and less prone to bugs than using a user interface.
Our algorithms also addressed some of the caveats mentioned in the study, such as units conversions, data gaps, or resampling. All these are now addressed automatically so the process of calibration is made easier overall.
Conclusion
With their 2018 results, DOE’s NREL/ORNL put the bar very high in terms of building energy model calibration, a field that has grown steadily over the past decade.
With all the data provided along with the study, we were able to recreate the exact same conditions of the experiment. Our algorithms managed to predict the total energy consumption 25.9% more accurately than DOE’s NREL/ORNL algorithms overall and it’s also worth noting, with little less variance (5.4%).
Landlords and property managers prone to engaging in energy retrofits projects must always be reassured about their expectations. A reliable, accurate way to predict energy savings is key to foster trust and commitment, thus encouraging more and more retrofit programs to arise.

Indoor comfort and energy savings on autopilot
Thermal comfort and indoor air quality are very correlated to staff health and cognitive performance, studies say.
Since human resources are businesses’ largest expense, it’s time to give them the best.