Data Science at EnergyWise – Part 2

This is the second article in a series of 2 (1st article here) about how we see and do data science at EnergyWise. This article delves into technical aspects, and presents data collection processes, pipelines, machine learning and infrastructure we have in place.
What we do
Let’s first explain main tasks we’re trying to tackle.
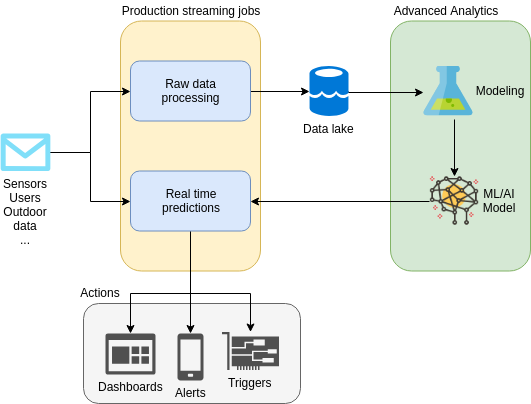
Overview of an end-to-end ML pipeline
Correlations & causal inference
Looking for correlations, or better, causality, is a discipline that applies to a variety of situations. For instance when there is a doubt about a device feature that may have a side effect on another, or when we want to know what causes users to develop a particular habit or act a specific way. Another interesting application is to find how user habits or external factors like outdoor air pollution reflects on sensor data. A great example of one of our recent study demonstrates a temperature side effect called off-gassing
Analytics and visualizations
Probably the most common aspect of data science: extracting value (metrics, KPIs, charts) from data and communicate it to stakeholders. In IoT, monitoring and analysing devices life cycle represents a significant part of this job. For instance, checking effect of a firmware release on a product (e.g has connectvity improved? how many upgrades are failing?). An other less common aspect is reporting about manufacturing: we build our own test equipments for products we manufacture, and of course these small servers (we call them test rigs, they help testing electrical boards and components directly on the manufacturing assembly line) send us a lot of data from different factories. Consolidating this and detecting problems is crucial.
Machine learning to solve complex problems
Machine learning can be applied where problems start to be hard to solve with basic analytics or simple statistics. Modeling and productizing ML models adds significant overhead in terms of complexity and engineering, so we’re always cautious about how and when to apply ML. However, some of the problems we face require this level of sophistication in order to get an appropriate solution.
One of them is device calibration: we do real time calibration on some of sensors using regressions. A bit trickier, we developed (but still improving) air quality events detection and classification, using clustering, supervised and semi supervised learning techniques.
Some of our current biggest challenges also involve machine learning, like automatic hardware/software failures detection, maintenance prediction or automatic ventilation systems control (provide clean air without human intervention, no matter what activity is going on).
Stream processing
Stream processing is inherent to IoT as we often need to react within a few seconds or minutes to events. A traditional batch approach doesn’t suit well in that case. For that purpose we use a stream processing framework along with appropriate techniques (like aggregations on sliding windows) and statistics (like moving averages). We also ship machine learning models in our real time pipeline so we can make predictions on fresh data (e.g. air quality classification).
How we do it
Diving deeper into technical matters, here are details about how data is processed.
Data pipelines
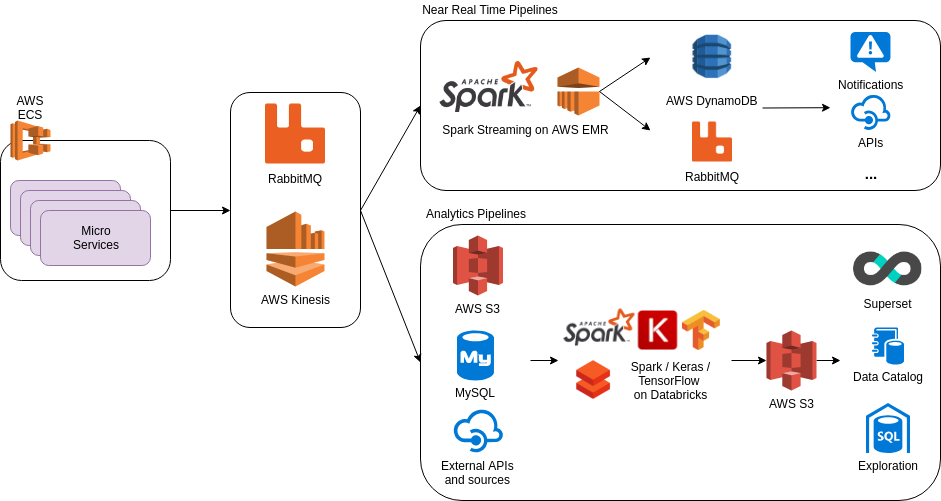
Pipelines technical overview
We have 2 main types of pipelines: the hot path – near real time processing pipelines – and the cold path – analytics pipelines (batches). We generally use the hot path when a response is needed within a few minutes (max 1h), and batches otherwise.
Near real time processing serves the purpose of creating running/moving aggregations, reacting to events and sending alerts, or predicting using models. Batching is about creating new datasets and populating our data warehouse with data that will be used later.
The cold path is implemented first using ELT pattern (Extract Load & Transform as opposed to ETL): data we have is sent to our data lake without pre-processing, filtering or formatting of any sort. Schema is applied on read, mainly with transformers jobs that populate the warehouse, or when data analyst requires access to “raw” values. ELT pattern is particularly suitable to IoT as devices can fail, send inconsistent data, and data schemas can change rapidly.
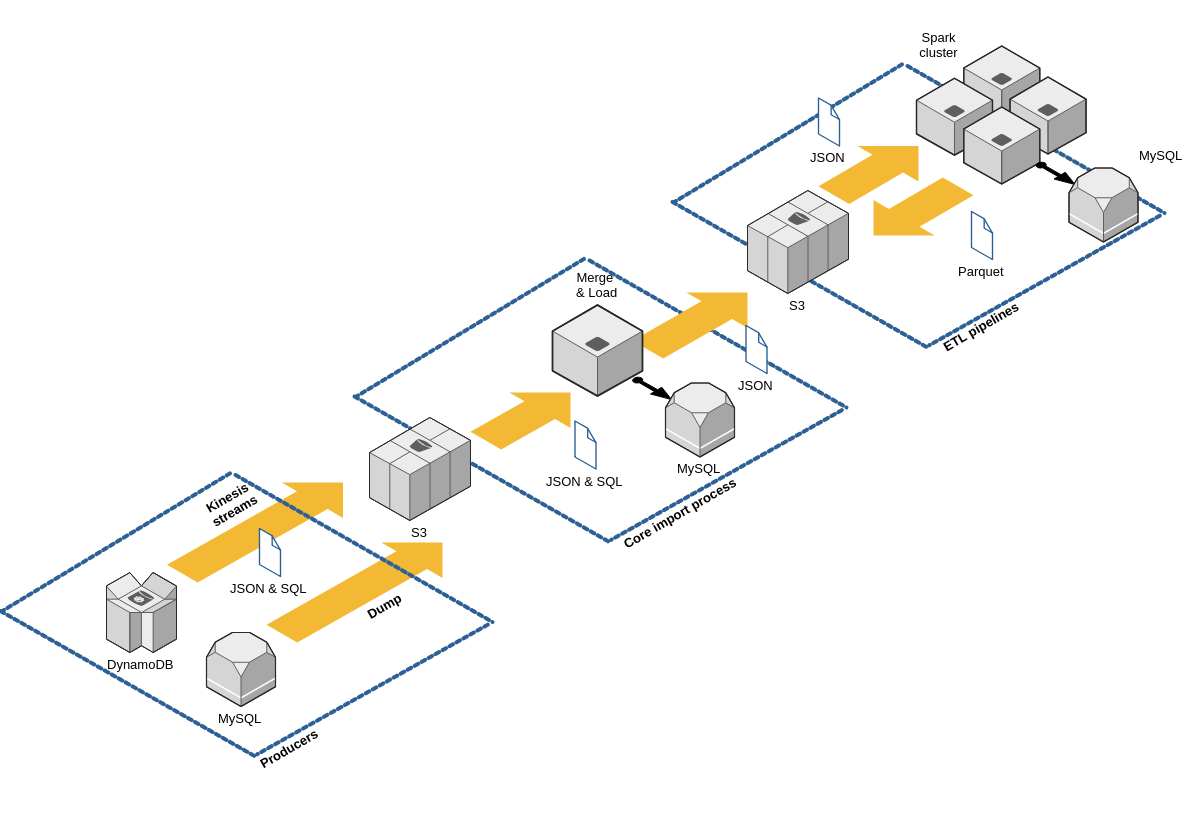
ELT infrastructure overview
Pipelines are then created by first dumping into the data lake, then pumping it into our data warehouse or through analytics jobs. As it’s easy to create new data sets and new pipelines, number of tables we have to handle grows rapidly (but we try to compensate with good documentation).
Most of our datasets are built on top of logs: every change is persisted with a timestamp (event time when available, processing time otherwise), which let’s us investigate things with accuracy.
Eventually, the amount of data to store is much bigger, but it contains vital information, and we apply patterns like event sourcing to take full advantage of it. Also, most statistical programming language or framework (R, python’s pandas, SQL, Spark) have convenient routines and operators to deal with time series like these (lead/lag, rank, correlation operators, …)
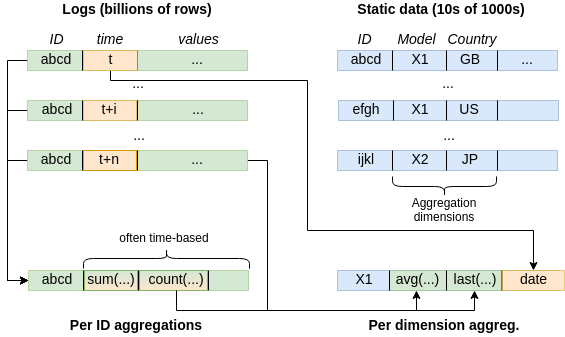
Sample aggregations from logs
Collaboration
One of our favorite collaboration tool is notebooks. We’re using Spark all the way down the data processing line, and Databricks for most of our projects. Notebooks offer a perfect environment for sharing ideas, presenting results and demonstrating new analytics or algorithms. It’s also development cycle-friendly as it integrates with source code versioning (git).
Data products
All that we do don’t always ship in production, but most of the time it does. When it comes to productizing, tasks like exposing an API endpoint, or creating a new view in our apps, are required. Recently, data science work we shipped in production include real time air quality classification, sensor calibration functions, and in app analytics.
Data products are complex artifacts to handle in terms of development, especially when ML is involved, as we’re adding complexity and new potential problem sources (data & models) to something already complex (coding). When it comes to shipping data science work in production, it can get tricky too: validation, user testing, or deployment require careful handling. That’s why we’re relying on a few reliable frameworks (like Spark) and techniques (like cross validation or A/B testing).
Data as a service
A data warehouse is a good solution to apply a schema and extract value from large datasets. It’s also great to provide a simple way for data analysts or business people to interact with data. As there is often a “missing dimension” in your last chart, why not let them explore data and see what they can find? Of course this requires business users to be guided and learn some SQL basics. Alternatively, pre-defined data sources and charts can be a great asset for teams without sufficient technical knowledge to access data directly.
On our side we’re now using Apache Superset which provides the best of both worlds, as it brings SQL capabilities with a great way of creating data sources (tables) and charts (slices). It’s easy for non technical users to pick existing assets, modify them, and create their own visualizations.
Another data exploration channel we’re exploring is accessing our data lake and warehouse (stored in S3) with new tools like AWS Athena. You can manage a catalog of data sources, schemas, and query data directly from there using SQL without worrying about infrastructure. Powerful.
Conclusion
In this series of 2 articles, we’ve tried to give an overview of how we use data at EnergyWise and why. So far, this has been beneficial to many projects.
We are dedicated to continuous improvement and scaling of our data science process. There are big challenges ahead, and expectations are high.
Data is more than ever fueling products design, experimentations and discoveries, helping us innovate.